A brief introduction to the science of Climate Change
Earth’s Atmosphere
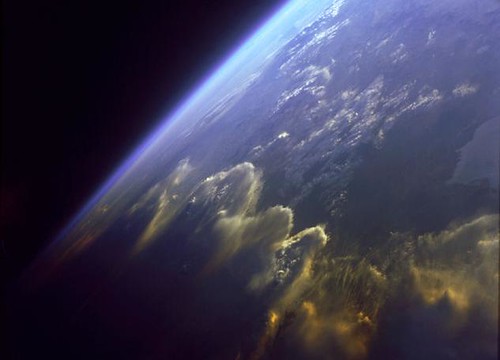
Earth’s atmosphere is a very very thin film of gases surrounding the planet. This film and it’s interaction with the surface is where life exists and is called the biosphere.
50% of the gases in the atmosphere are contained within the first 5km. 90% is contained within the first 15km. It is within this layer, the troposphere where all the weather happens and where the greenhouse effect takes place.
The atmosphere is 20% Oxygen, 79% Nitrogen. The remaining 1% is mainly water vapor and carbon dioxide, the most important greenhouse gases. These gases trap the sun’s heat and keep the planet warm at an average temperature of +15°c. Without this 1% the earth would cool to an average of -15°c and life would not exist.
Greenhouse Effect
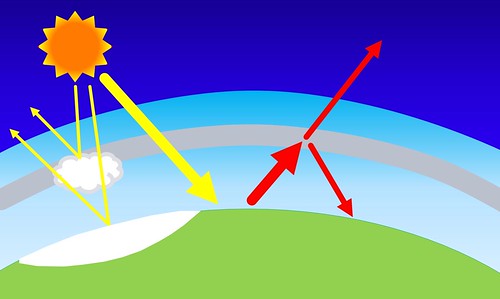
Incoming solar radiation from the sun, visible light, strikes the planet. Some of the light is reflected back into space from ice and clouds but most of it reaches the surface which heats up. The heat is radiated back out to space in the form of InfraRed radiation but some of this heat is absorbed by GHGs and re-radiated back down to the surface. This effect is much like the way a layer of cloud keeps the heat in at night. The gases that do this work are primarily water vapor (H20), responsible for about 2/3 of the effect and carbon dioxide (CO2), responsible for 1/3.
The important point is that the greenhouse effect has been in operation for billions of years. Without it life would not exist. Although global warming is new to the media it has been known to science for well over 200 years. What we observe now is enhanced global warming caused by the increase in GHCs, primarily carbon dioxide.
The Carbon Cycle
The carbon cycle is the cycle of life. Plants and animals are made from carbon and it is continually cycled through the atmosphere. As plants grow they absorb CO2 from the atmosphere and convert the carbon into themselves using water and photosynthesis. When they die and decompose or are burnt the carbon is released back into the atmosphere.
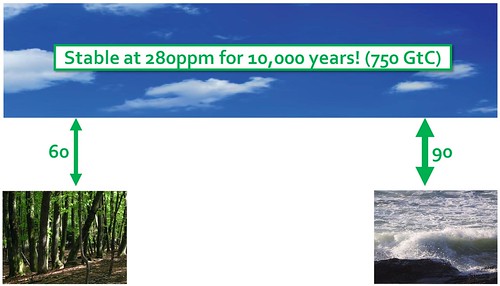
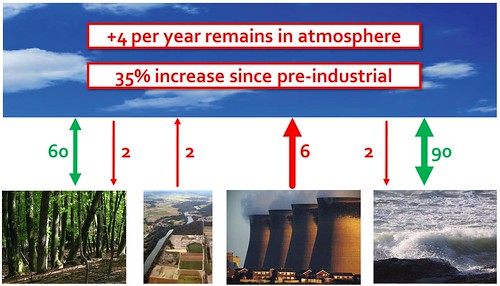
60GtC is exchanged between the plants and the atmosphere each year in both directions. A similar and greater exchange occurs between the ocean and the atmosphere through surface mixing and the growth of algae and plankton.
This natural cycle is in balance and concentrations of CO2 in the atmosphere have remained relatively constant since the end of the last ice age 10,000 years ago until the beginning of the industrial revolution.
Human activity has interfered with this natural cycle by adding 6GtC/yr from the burning of fossil fuels and 2GtC/yr from land use change and deforestation. Fortunately, both the land biosphere and the oceans take up half of this extra input. This has led to increased plant growth and acidification of the oceans.
Half of what we emit, however, remains in the atmosphere where concentration levels have risen by more than 1/3 since pre-industrial times.
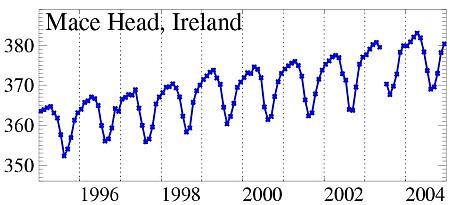
Atmospheric measurements taken in Ireland and around the world show this yearly flux of carbon between the atmosphere and the life it supports, but with a steady background increase year by year, the result of human activity.
The Ice Core record
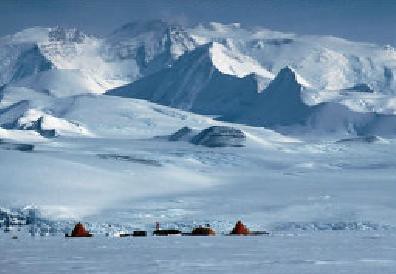
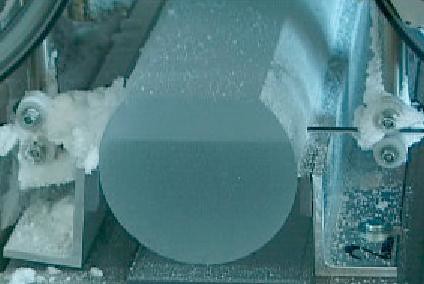
As the snow falls in Antarctica and Greenland it traps bubbles of air with it. Over the years and centuries successive layers of snow are compressed into ice but the small air bubbles remain intact. By drilling down into the glaciers scientists can extract ice cores from Greenland and Antarctica that allow us to determine the concentrations of the various gases in the atmosphere at the time the snow fell. This builds up a picture of how the global atmosphere changed over geological time.
The graph below shows the CO2 concentration through the ice ages and up to the present day – as determined by examining ice cores. It has been known since 1850 that CO2 is responsible for the greenhouse effect and that this gas keeps the planet 10° warmer than it otherwise would be. What we are seeing now is ‘enhanced’ global warming due to the extra CO2 we have released into the atmosphere.
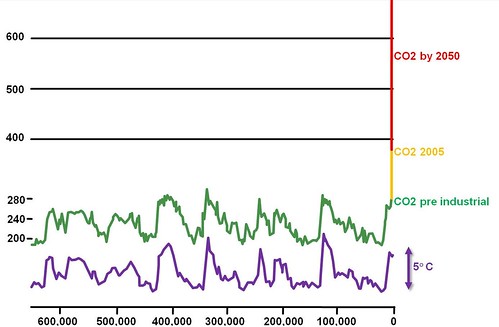
During an ice age the CO2 held at about 180ppm. As we came out of the last ice age it rose to about 280ppm and remained more or less constant up to the beginning of the industrial revolution. (It is interesting to note that the average global temperature difference between an ice age and a warm period is only 5° with a corresponding CO2 difference of just 100ppm).
After the industrial revolution the CO2 level rises dramatically to 380ppm today and continues to rise at 2ppm per year. The observed temperature increase so far is 0.7° with an expected 1° more already ‘in the pipeline’. More startling is that unless we rapidly change course the concentration level will rise to 580ppm by the middle of this century. Thats 400ppm more than during an ice age! If 100ppm is the difference between an ice age and the climate of the 19th and 20th centuries then what will an extra 400ppm bring?
Another point to note is that the rate of change of CO2 concentration is more rapid than anything in recorded history. The fasted rate of change recorded was approx 3ppm per century as the world shifted between cold and warm periods. Today we are adding CO2 at a rate of over 2ppm per year!
The concentration levels of other GHGs such as Methane (doubled) and Nitrous Oxide have all risen dramatically over the last century.
The last time CO2 levels were at today’s level was 3.5 million years ago.
The last time CO2 levels were higher than today’s level was 50 million years ago – when sea levels were 300 ft higher than today.
The “Hockey Stick” graph
The graph below shows the recorded global average temperature rise since the year 1000 until the present day. It can be seen that there has been an increase 0.8 °c since pre-industrial times. Because CO2 is a long lived gas in the atmosphere (100years) and because of the enormous thermal inertia of the oceans we are committed to a further 0.8 °c temperature rise even if emissions are stopped today.
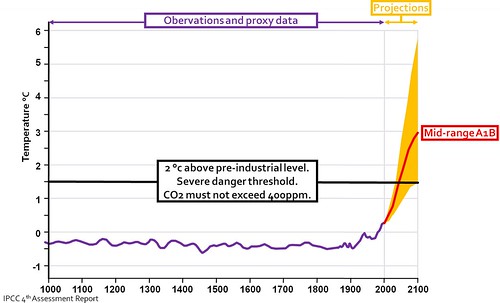
The International Panel on Climate Change projections of likely temperature increases by the end of the century vary from 2 °c up to almost 6 °c if emissions are not drastically cut back.
+2 °c is now suggested as a “safe” increase in global average temperature. To achieve this will require greenhouse gas emissions to stabalise at 450ppm carbon equivalent of which the CO2 component must stablise at 400ppm. We are now at 386ppm. This target will require an 85% cut in emissions by 2050, effectively a phase out of fossil fuels.
It is important to remember that nobody lives at the global average. +2 °c can give the false impression of a small rise in temperatures. Increases will be much higher over northern latitudes, over land and at the poles.
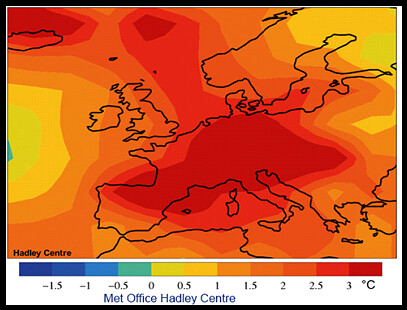
One forecast produced by the MetOffice shows that by 2050 the temperatures of the 2003 heat wave in France which killed 16,000 people will be normal by 2050 and cool by 2060!
Climate Impacts & Hotspots
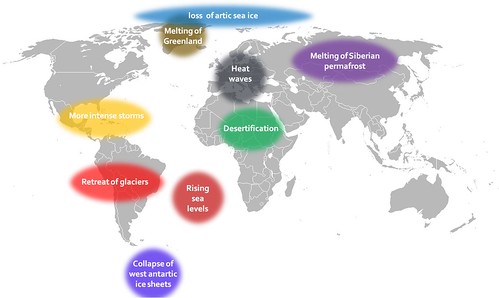
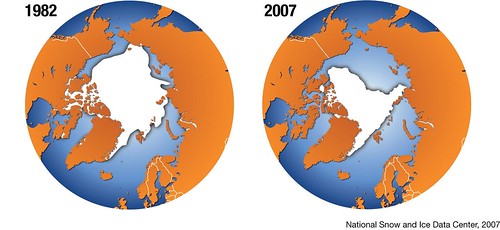
Loss of the North Pole
The arctic has already seen a 40% reduction in the last three decades. As the ice melts less sunlight is reflected back out to space. The newly exposed dark ocean soaks up more heat causing more ice to melt. All summer sea ice could disappear as early as 2030.
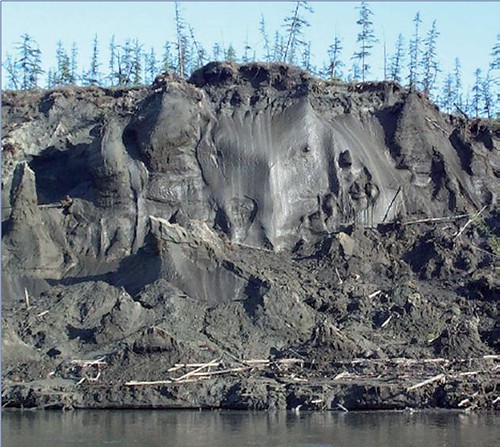
Siberian Permafrost
As the Siberian permafrost melts Methane trapped within the frozen bog escapes into the atmosphere causing further increases in GHG concentrations. Permafrost has warmed by up to 2°c since the 1980s.
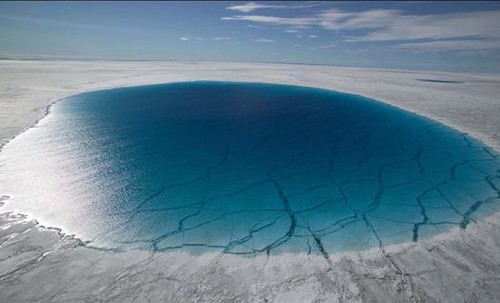
Greenland ice sheet
Total Greenland ice sheet melt area increased on average 20% from 1979 to 2006. On the western part of the ice sheet the melt area increased by 30%. The increasing trend in the total area of melting bare ice is unmistakable at 13% per year. The average Greenland temperature is already up 3°c. If the global average temperature rises by more than 3°c it is likely that we are committed to a total melt of the ice sheet which would raise sea levels by 5m within centuries – not millennia.
Jakobshavn glacier
The calving front of the jakobshavn glacier in Greenland has retreated inland over 40km since 1900. Between 1985 and 2006 its speed has more than doubled after rapid thinning and breakup of its floating ice tongue.

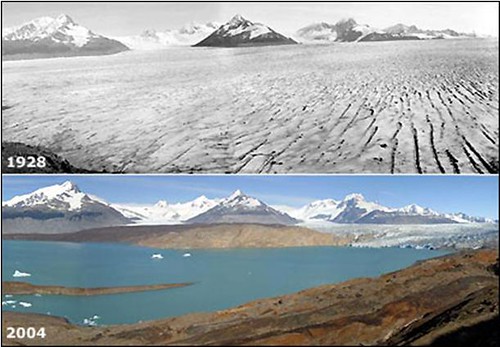
Patagonian ice fields
The Southern Hemisphere’s largest non-Antarctic ice masses are the Earth’s fastest retreating glaciers, contributing more than 9 per cent of global sea-level change from mountain glaciers.
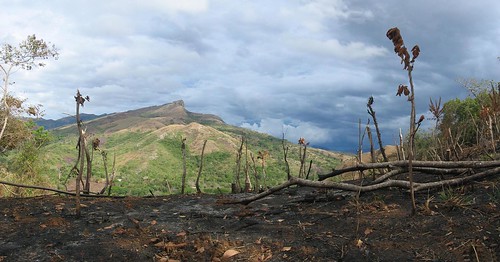
Amazonian Drought
A sharp warming of the Atlantic has been identified as a possible factor in the Amazon’s severe drought of 2005. If climate change should push the Amazon towards more droughts this, coupled with deforestation, could lead to massive rainforest loss. This would destroy half of the world’s biodiversity and give a massive boost to CO2 levels as well as reducing the amount of Oxygen produced by the biosphere.
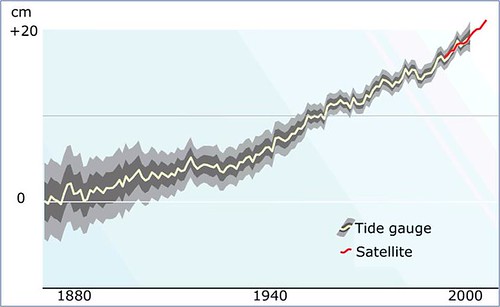
Rising Sea levels
As the oceans warm up thermal expansion leads to a rise in sea level. This is increased further by the run-off from melting glaciers and ice sheets. Global sea level rose at an average rate of 3.1mm per year over the period 1993 to 2003 and could rise by as much as 1m by the end of the century. This is already effecting low lying coastal areas and tropical islands.
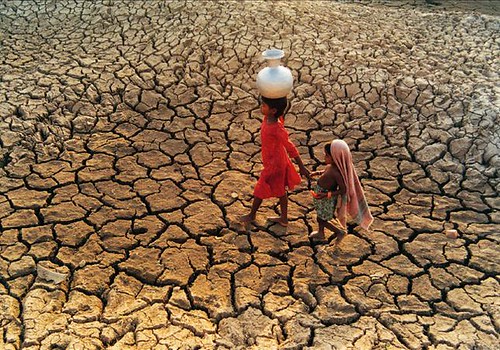
Increased Drought
Poor communities are most directly dependent for their livelihoods on a stable and hospitable climate. Many areas, including southern Australia and parts of Africa, are seeing longer and more frequent droughts as the climate gets hotter.
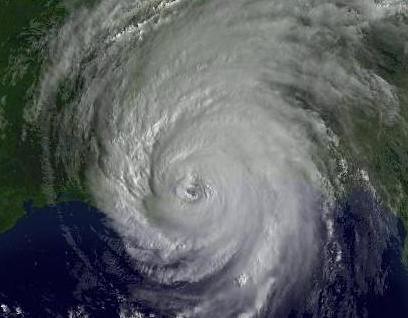
Hurricanes and typhoons
As the world warms, the intensity of hurricanes, such as Katrina which ravaged New Orleans in 2005, is steadily rising.
Loss of Biodiversity
Climate change could kill more than a third of the world’s plant and animal species by 2050. As the world warms species are loosing habitat and unable to adapt to the rapidly changing conditions.

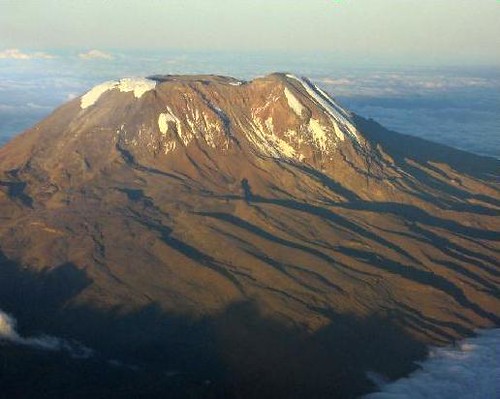
Equatorial Mountain Glaciers
The glaciated area of mount Kilimanjaro shrank by 80% in the last century. The forecast is for the icecap to totally disappear between 2015 and 2020.
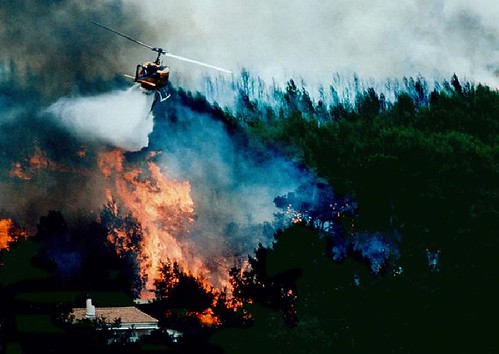
Forest fires
Hot, dry summers are fuelling massive blazes across the high-latitude forests of Russia and North America.
Heat Waves
The European summer heat wave of 2003 killed more than 40,000 people. One study carried out by the UK metoffice showed how by 2050 such summers will be normal and that by 2060 they will be cool!
Methane Hydrates
Methane Hydrates, locked within the seabed at the bottom of deep oceans could become unstable as the sea temperature rises. Should that happen, global warming could go well beyond current projections leading to runaway climate change. It is believed that methane hydrates may have been involved in some of the most intense warming periods in Earth’s history.